- 25 Sep 2024
- 1 Minute to read
- DarkLight
Launch Case Data Visualization
- Updated on 25 Sep 2024
- 1 Minute to read
- DarkLight
OWL Software Edition Module or Feature Available In
Standard
Advanced
Enterprise
Enterprise Plus
Enterprise Advanced
Smart City
Launching the Case Data Visualization will provide a robust view of your case details. This is a great tool to utilize to view case related and linked data on one screen and in different views. This feature also eliminates the process of piecing together disparate information, making viewing and analyzing case data a seamless action.
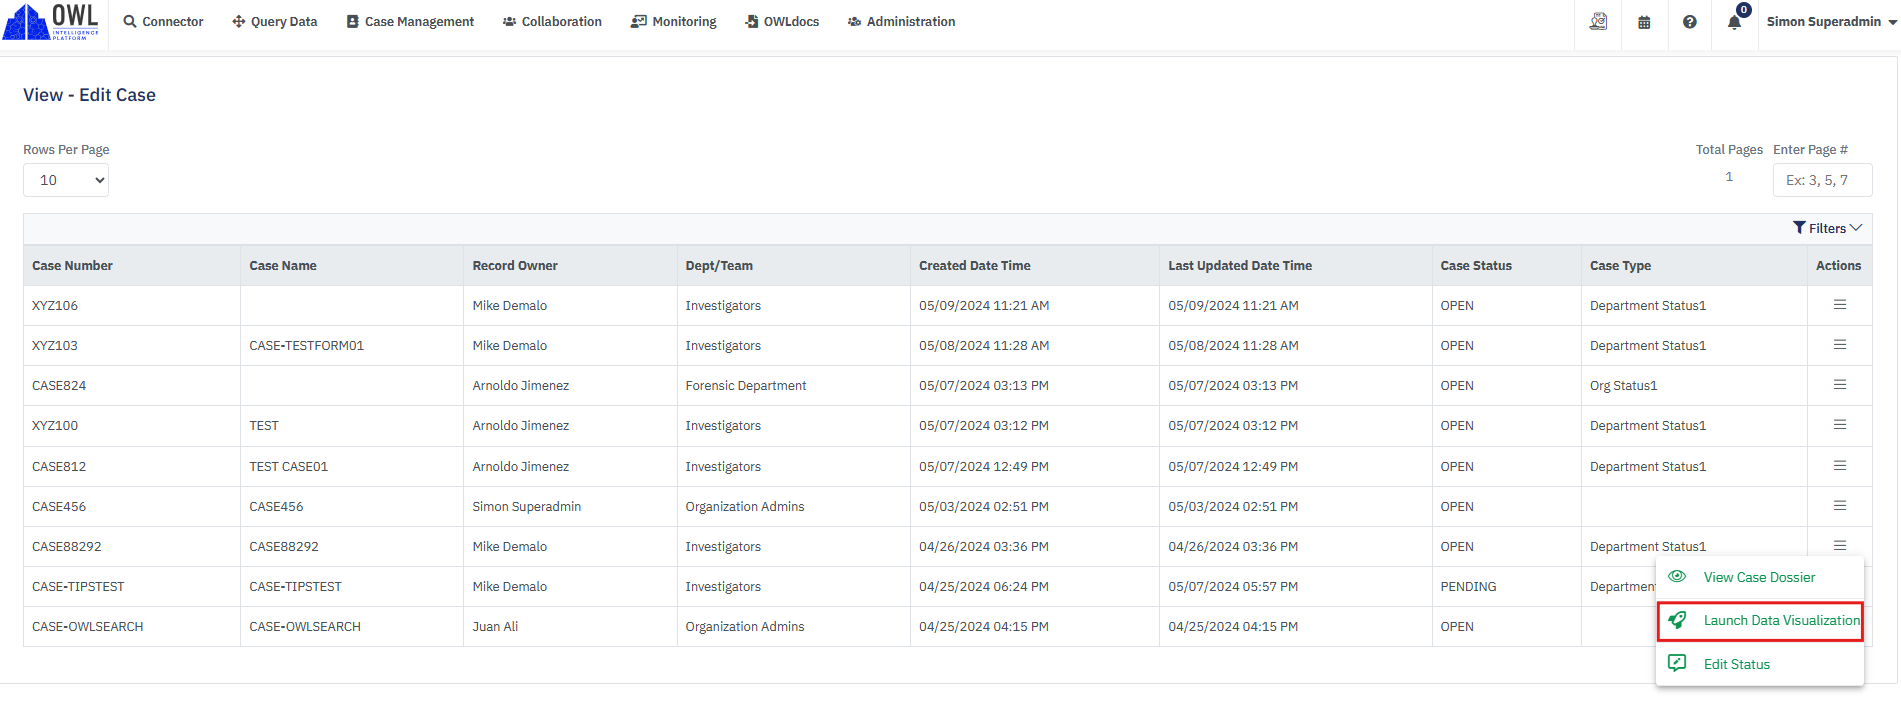
Steps to launch Launch Data Visualization:
Hover over Case Management.
Hover over or click Cases.
Click View-Edit.
Click the action menu under the Action column for the relevant case.
Click Launch Data Visualization.
A new tab will open.
All the query searches performed under the case will be shown on this screen with different views such as Link Analysis, Tabular View, Geospatial View, and Timeline View.
 If no searches have been performed for the case you would like to launch Data Visualization, the system will disallow you from accessing the feature and will display No Associated Searches.
.png)

